Warning about SMSF stats on investment allocation
Super
Recently released SMSF insights prove that it’s important to be wary of the source and use of investment allocation statistics. Take a closer look, the experts urge.

The ATO release their quarterly SMSF statistical report which is usually followed by an influx of commentary from self-proclaimed SMSF specialists. They deride the SMSF sector for asset class concentration and lack of diversification, particularly in relation to international exposure. These claims are typically based on false assumptions that are not from the ATO but by the commentators.
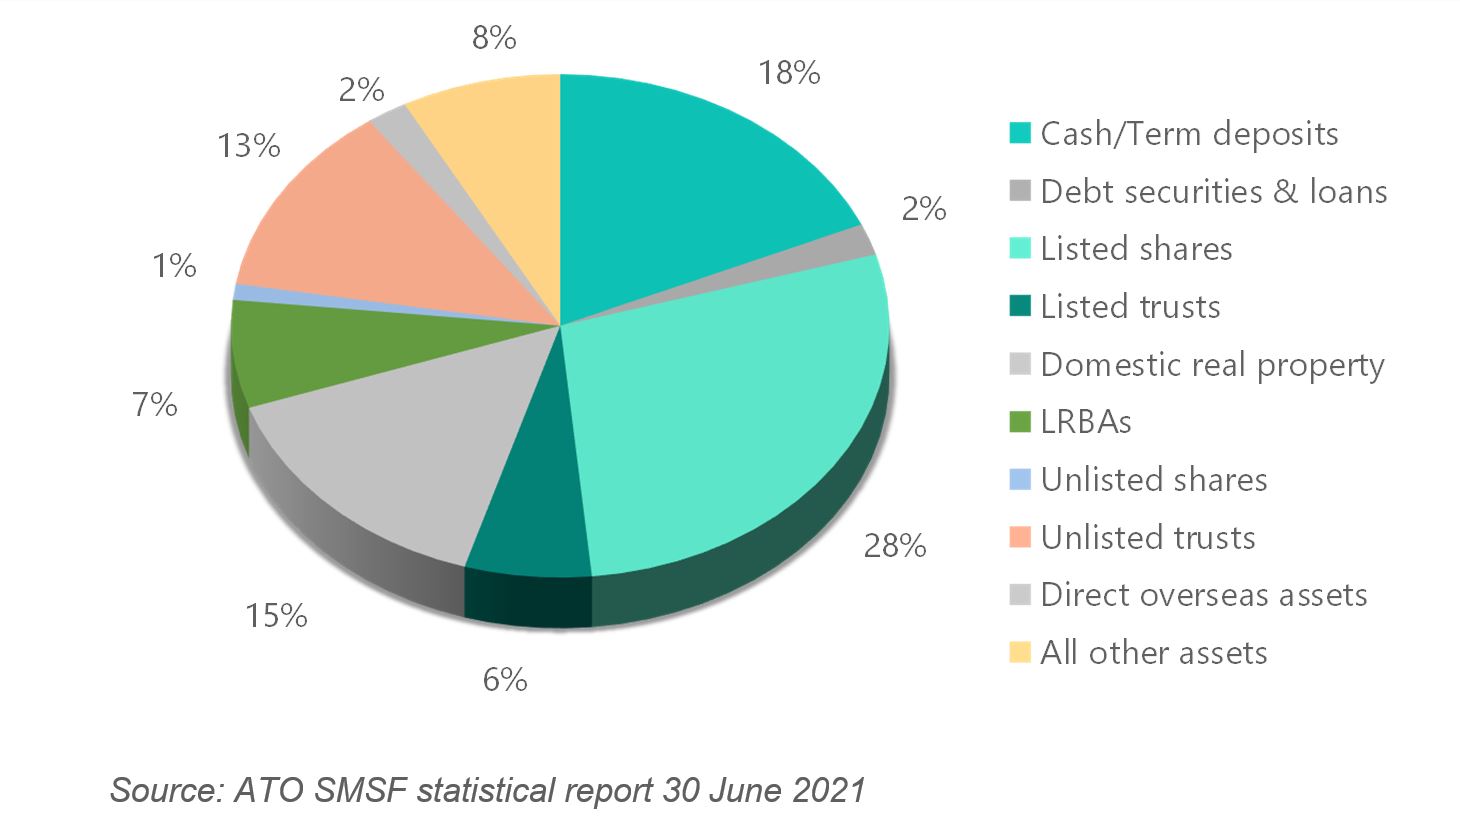
These key assumptions are that the data is as at the quarterly date, the ATO is reporting asset allocation and all superannuation allocations are the same. So, here is the latest ATO data published in September 2021, effective for 30 June 2021.
So why should these assumptions be looked at more closely and the data not excessively used for determining how SMSFs invest? To do this, we need to examine where the data comes from and what is its real use.
What date applies to the data?
When we talk about investment data for SMSFs we refer to the ATO’s source of information in Section H the SMSF regulatory return lodged each year. The timing of the actual lodgement will depend on the SMSF, which may mean its return may not be lodged until May the following year. Consequently, the primary source of data remains to be the 2020 returns and not the 2021 returns. We also know that the ATO does take some time to analyse each year’s regulatory return data as they publish an annual statistical summary. The latest of this report was published in March 2021 based on the 2018-19 data, which suggests there is still a wait before the 2020 data will be ready.
This means the 30 June 2021 quarterly statistical report, published in September 2021, is at best, a combination of an extrapolation of the 30 June 2021 data weighted with a proportion of data that comes from both any 2021 returns lodged with the ATO and the number of new SMSF established after 30 June 2020. At its worst, it is an extrapolation of the 30 June 2020 return data only which means it is 15 months out of date by September 2021.
Cash holdings
The time delay in reporting means any actual investment decisions made by all SMSF trustees since 1 July 2020 are not directly reflected in the September 2021 publication. This is most obviously reflected in the cash holdings for SMSFs.
Most contributions received by the SMSF sector are NOT employer contributions and particularly Superannuation Guarantee (20% of all superannuation contributions received by SMSFs) as is the case for APRA Funds (80% of all contributions made to these funds), which are required to be paid quarterly throughout the year. Additionally, most of the SMSF member contributions are made in the June quarter of each financial year and thus not invested by 30 June each year but may well be invested after 30 June resulting in an overstatement of the level of cash in SMSFs.
The other element of the SMSF cash holding is due to the nature of the membership. 45% of SMSFs are partially or fully in the pension phase compared with about 15% of APRA funds. This is important because SMSFs have a negative cash flow from contributions vs benefit payments compared with APRA funds and thus hold a higher amount in cash to meet their pension obligations.
The combination of accumulation funds having year-end contribution receipts and pension paying funds holding cash to make payments results in a higher than usual cash level.
What are the classifications
The reality is the categories that appear on the SMSF regulatory return are not asset classes at all but are about structures, i.e., how does the SMSF hold its assets and where are the structures based. The major classifications are Australian managed investments, Australian direct investments and overseas direct investments. While some of the direct investment classifications align with asset classes (real property), this is also not the case for others. The most obvious classifications where this is the case are listed and unlisted trusts of which managed investment schemes (managed funds) are the most common. In these cases, the classification does not reflect what type of assets are held in the trust so determining which asset class they relate to is speculation. As we know, managed funds can invest in a range of different assets and asset classes from diversified funds (balanced or growth funds), sector or even sub-sector-specific (international equities, small caps, mortgage) or even specific purpose funds (income funds, absolute return etc.).
If you consider listed trusts, these would be vehicles investing in real property, ASX listed shares, international shares, private equity and specialist assets or business sectors. This has now started to also occur within the listed share category, which carves out listed debt securities and listed trusts but would include listed investment companies and ETFs in this category.
This results in commentary particularly about underexposure to international markets being based on the tiny percentage of directly held international assets when the reality is, most international assets are held through vehicles be they managed funds and more recently ETFs.
It is also interesting to note that this is significantly different to the categories that APRA uses to collect investment data about those funds which do not come from those funds’ tax returns.
What is the ATO really reporting?
So, this begs the question why does the ATO classify the investments this way? The rationale for this classification methodology is about data matching of the Fund’s income. As anyone who has seen e-tax, the ATO can pre-populate a significant range of income sources for a taxpayer, potentially including an SMSF even if they don’t provide this.
This is achieved as almost all investment providers are required to collect the Tax File Number of the investor. These bodies then provide information to the ATO about the income they earn and pay to each investor.
So, if you earn interest from investment, then the bank, note or debenture issuer will advise the ATO of the interest you paid along with your name & TFN. For listed securities, the registry provides the dividend details (cash dividend and franking amount) as well as your details.
If you invest in a managed fund, a wrap platform, SMA or MDA, the product provider has a similar obligation to provide an Annual Investment Income Report to the ATO which outlines the underlying taxable transaction that occurred in the investment entity that gives rise to a taxable income for the investor. This included interest, dividends (including franking credits) and realised capital gains.
Even small entities have reporting obligations that allow this data matching. Small companies with less than ten investments and pay more than $1 in income must include a dividend and interest schedule in their tax return. A similar mechanism applies for trusts through the trustee beneficiary statements attached to the trust tax return
All this data enables the ATO to verify both where the SMSF holds its investments and the taxable income it declares in its tax return against information already provided to the ATO.
So, next time some calls this asset allocation data just think twice about what it really is.